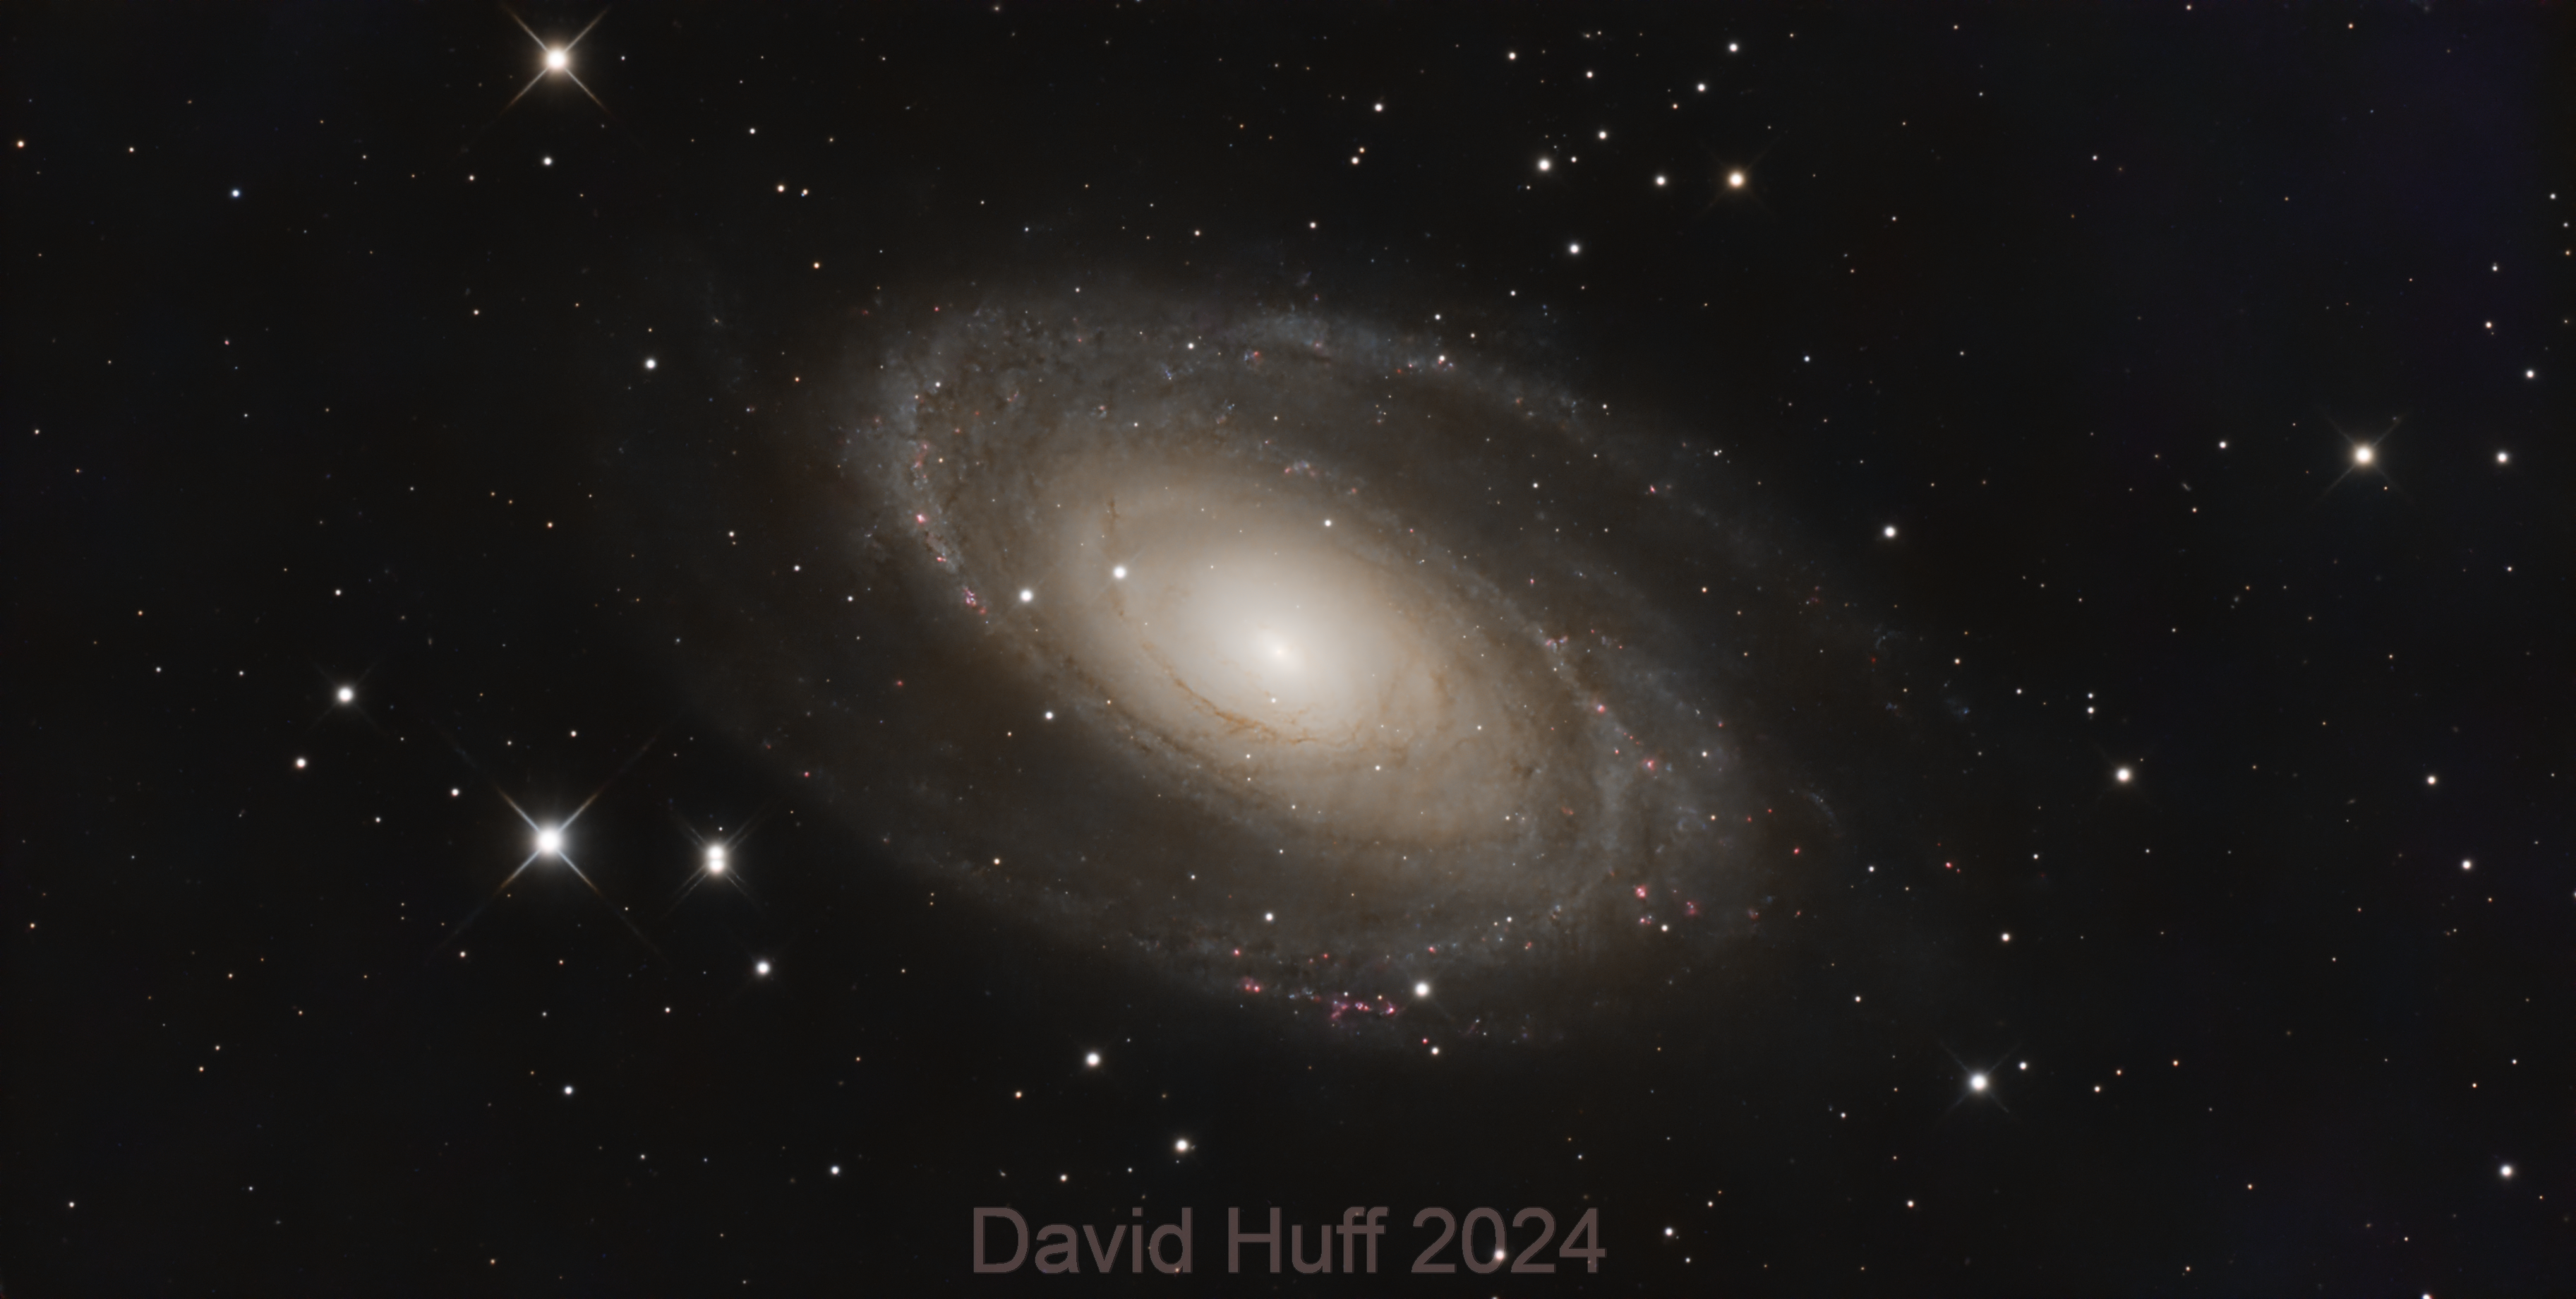
This image is the result of my Fast Imaging project in an attempt to produce my most detailed image of Messier 81 from a light very polluted area. This project began in December of 2023 and though a lot of trial and error, research, and a high electric bill, I finally found the best way to capture and process this subject. Over 80,000 images were taken but only a total of 52,464 sub exposures were kept as I tried from 0.1 second all the way to 30 second exposure times but settled on 21,834 x 1 second and 29,210 x 2 second sub exposures in broadband then 1,420 x 30 second sub exposures using the IDAS NBZ-II filter to capture the faint Ha and apply to the image using continuum subtraction.
See more details like equipment used on my Astrobin: https://www.astrobin.com/q0fzhe/
This was one sub exposure!

Why fast imaging? Glad you asked 🙂. I was never able to image galaxies because they would get lost in the light pollution. This technique seems like it helps a lot! These are my rejection frames from the finished stack and the reason why I used this fast imaging method... Light Pollution! As you can see it does a good job rejecting it! Here is an excellent lecture given by Robin Glover that where I got the idea: https://www.youtube.com/watch?v=3RH93UvP358

These were my image processing steps and settings:
- Use WBPP to calibrate darks, flats, and lights (don't debayer yet if OSC). Using darks instead of biases reduce the need for CosmeticCorrection depending on your sensor but add CosmeticCorrection if you still have a lot of hot pixels.
- If using mosaiced images, debayer all of the files into one directory to be used for the FastIntegration process. I used bilinear demosaic for a little speed boost.
- If necessary, use Subframe Selector to analyse and remove frames with lesser quality and excessive background brightness.
- Run the FastIntegration process using the best frame as a reference and the debayered images (calibrated subframes instead if mono, and do one color at a time using the same reference frame for all images) using the default parameters with the exception of selecting create drizzle files and set the integration and prefetch sizes to match your RAM configuration. Also create a fastintegration folder to output the drizzled files using the output directory section.
- Do the DrizzleIntegration process using the drizzle files in the previously created fastintegration folder using the following parameters:
- If using mosaiced data, make sure the check the Enable CFA Drizzle checkbox.
- If using mono data drizzle each color individually and do a channel combination process afterwards.
- For oversampled data, use 1x scale and 0.9 Drop Shrink.
- For well sampled or undersampled data, use 2x scale and 0.9 Drop Shrink.
- Note: You could also experiment with DrizzleIntegration parameters but I found these to be the best for my camera
- Process the resulting image like you normally would

Where I live I have a lot of light pollution and I ended up figuring out a way to analyze and create a Python script that could read the calibrated XISF file and then calculate the the Median Absolute Deviation (MAD) of the subframe data. Then create a report and graph for each run which allowed me remove the outliers that was most likely clouds or excessive light pollution. You can also do this with Subframe Selector and use the median as this can create a graph with similar results.
*** Update: I recently found out that stacking order does not matter for quality with FastIntegration, so you are better off leaving the order and removing any bad frames. I updated the instructions to reflect that.
Graph created by calculating the MAD of subframes to show excessive light pollution.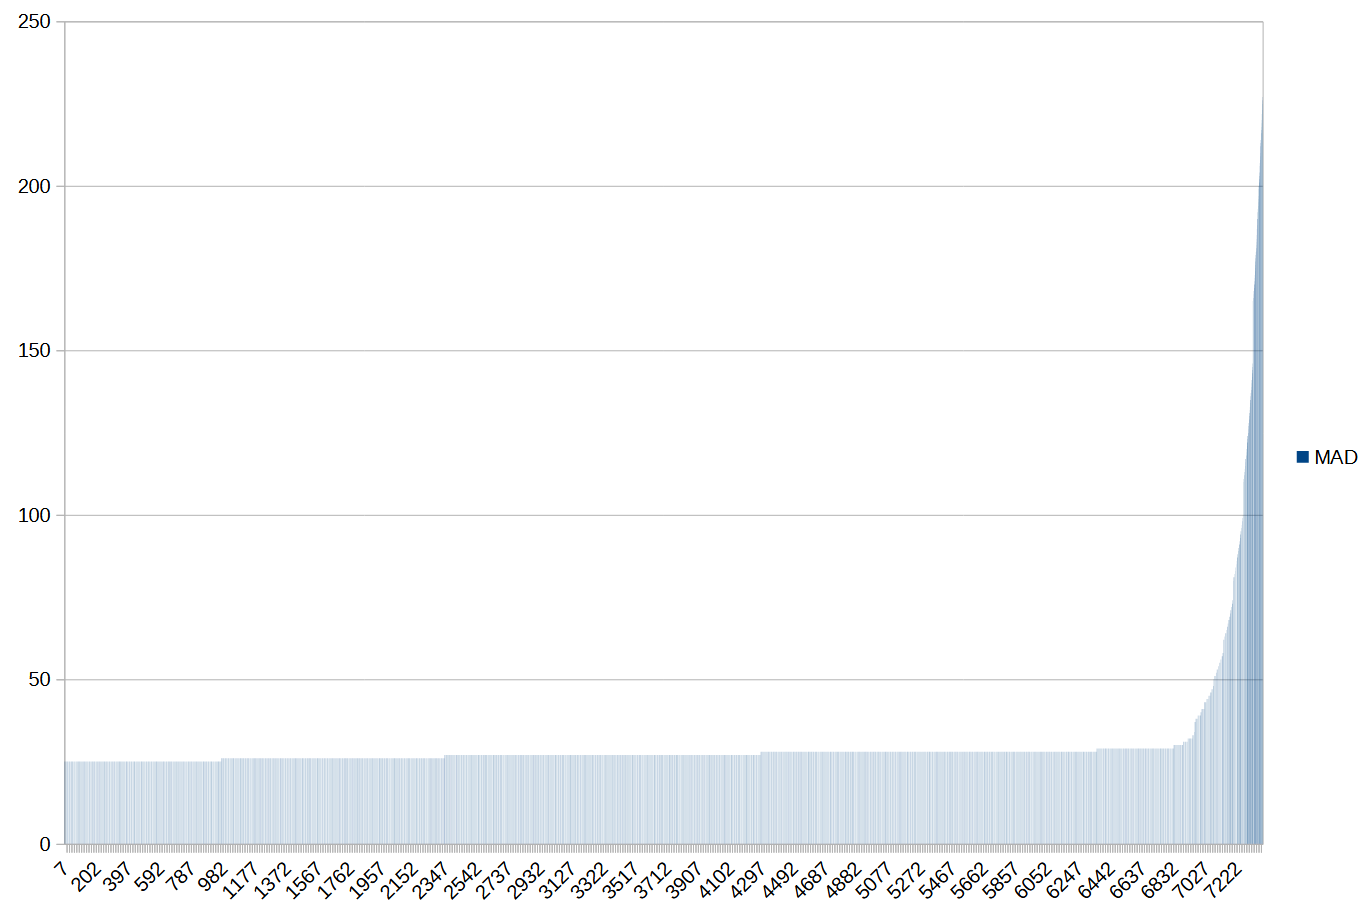
After debayering, I used FastIntegration to create an image with the remaining 52K subframes. I also captured about 1,420 30s dual narrowband sub exposures so I could do a continuum subtraction to add Ha to the image later. For those I just used regular WBPP for best image quality. In the end I decided I would just use the FastIntegration defaults with the exception maxing out the integration and prefetch sizese. Then it would drizzle later to try to remove any interpolation artifacts.
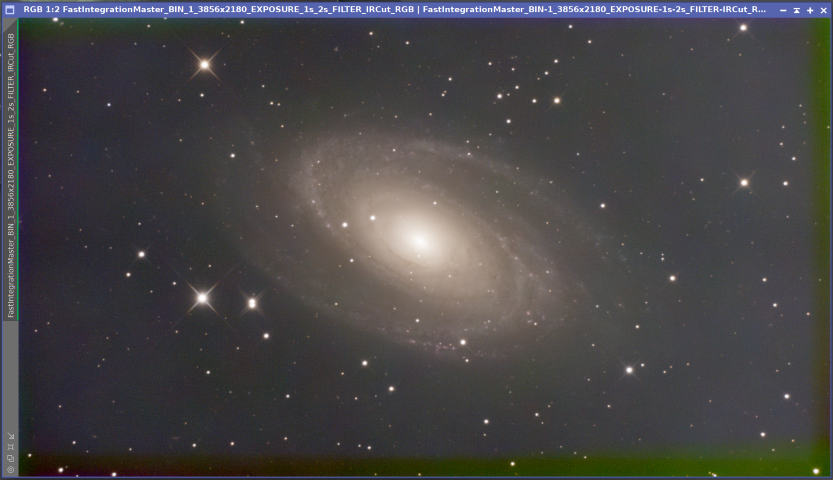
Speaking of drizzle this was another rabbit hole of research but in the end I found that because my data was oversampled, I settled on just using 1x drizzle with a 0.9 drop shrink. This cleaned up the image nicely though it required 15 hours more time, but it was worth the wait! The image below has not been color corrected yet.
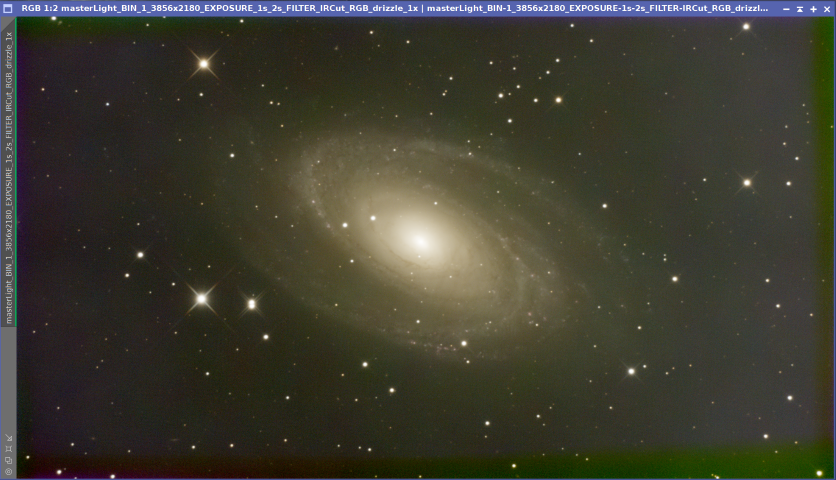
Here are the FastIntegration results and drizzle time at the bottom (not sure why the output doubled?):

Processing the resulting image is out of scope of this forum post but I am quite sure that everyone has their own way to make the image beautiful! In the end, I learned a new way to capture images from my even more light polluted location, bad seeing, clouds, and sometimes poor guiding to produce a detailed closeup view of M81 only using a 8 inch Ritchey Criterion telescope!
Clear Skies!
Dave
|
You cannot like this item. Reason: "ANONYMOUS".
You cannot remove your like from this item.
Editing a post is only allowed within 24 hours after creating it.
You cannot Like this post because the topic is closed.
A few more notes:
- I used SharpCap Pro sensor analysis of my Player One Uranus-C Pro (cooled) camera to find the optimum exposure that only produced 10% signal noise which was 2 seconds. Anything less than that like 1 second and less did not provide enough signal and required way too many sub exposures.
- I was forced to use the Uranus-C Pro which is an IMX585 sensor with 2.9um pixels because my P1 Ares-C Pro (IMX533 based) camera with 3.76um pixels was not available as I had to send it off to be replaced. This may have allowed me to use a 2x drizzle to bring out even more details as I have found testing on M51.
- I am awaiting feedback from the PixInsight team in regards to the technique using the Python script to pre-weight the images based on background brightness. I plan to release the script on GitHub when I get a chance to clean up the script.
- This is a prototype of the M51 image I am now working on. This was only 1,700 4 second subs. I will continue collecting more data on it to bring out the dust and other features.
*** UPDATE: Here is the completed M51 image https://www.astrobin.com/lmaor8/
Clear Skies!
Dave
|
You cannot like this item. Reason: "ANONYMOUS".
You cannot remove your like from this item.
Editing a post is only allowed within 24 hours after creating it.
You cannot Like this post because the topic is closed.
David,
This is a nice project but I am skeptical of your initial claim that this is a diffraction limited image. First, fast imaging does not remove the effects of atmospheric wavefront distortion. It can produce a diffraction limited image of the Airy pattern--IF the seeing is sufficiently good and the exposure is sufficiently short. Second, the isokinetic patch is typically pretty small and with tilt typically being the largest component in atmospheric wavefront distortion, it will vary over the field. When you stack a lot of images, the tilt won't be constant across the field and the increase in image sharpness gained from short exposures will be seriously diluted (relative to the diffraction limit.) The diameter of the Airy disk for your 200 mm f/8 system is about 1.4" but the FWHM will be 0.58". Did you measure the FWHM of the stars in your image to confirm that they are about 0.6" FWHM?
You have produced a nice, sharp image but is it really diffraction limited?
John
|
You cannot like this item. Reason: "ANONYMOUS".
You cannot remove your like from this item.
Editing a post is only allowed within 24 hours after creating it.
You cannot Like this post because the topic is closed.
John Hayes:
You have produced a nice, sharp image but is it really diffraction limited?
I would have to respectfully agree with John here. Since I recently completed an M81 image myself, I looked up several images of this object, taken with 8" scopes as I was acquiring and processing. I would be skeptical of the claim that the supplied image, while good, is diffraction limited.
|
You cannot like this item. Reason: "ANONYMOUS".
You cannot remove your like from this item.
Editing a post is only allowed within 24 hours after creating it.
You cannot Like this post because the topic is closed.
John Hayes:
David,
This is a nice project but I am skeptical of your initial claim that this is a diffraction limited image. First, fast imaging does not remove the effects of atmospheric wavefront distortion. It can produce a diffraction limited image of the Airy pattern--IF the seeing is sufficiently good and the exposure is sufficiently short. Second, the isokinetic patch is typically pretty small and with tilt typically being the largest component in atmospheric wavefront distortion, it will vary over the field. When you stack a lot of images, the tilt won't be constant across the field and the increase in image sharpness gained from short exposures will be seriously diluted (relative to the diffraction limit.) The diameter of the Airy disk for your 200 mm f/8 system is about 1.4" but the FWHM will be 0.58". Did you measure the FWHM of the stars in your image to confirm that they are about 0.6" FWHM?
You have produced a nice, sharp image but is it really diffraction limited?
John
Hi John,
The platesolved focal length of my telescope and focal reducer attached was 1050mm so using that focal length, I then used the formula ( Pixel Size / Telescope Focal Length ) X 206.265 so ( pixel size 2.9um / 1050mm focal length) X 206.265 = 0.56968 (or 0.57)seconds of arc. The aperture of my RC8 is 203mm so the Dawes limit is 0.57 seconds of arch and Raleigh is about 0.69. So as you can see I am right at the theoretical diffraction resolution limit according to Dawes limit for which I based this. But of course that is a theoretical figure as it does not take into account seeing conditions which vary throughout the night. And I understand that fast imaging will not remove wavefront distortion but thanks to brute force averaging, the times when the atmosphere is less distorted is added and more distorted is rejected. So I had to start my stacking process with the image with the lowest background, lowest FWHM, roundest stars as a reference.
I could not measure the smaller stars as they were very faint with such a fast exposure. Now you have me intrigued and I am going to do some star interferometry on one of my best subframes to see if I can find a good measurement. My applications only measured the brightest stars. Thanks for sending me back down the rabbit hole LOL.
|
You cannot like this item. Reason: "ANONYMOUS".
You cannot remove your like from this item.
Editing a post is only allowed within 24 hours after creating it.
You cannot Like this post because the topic is closed.
John Hayes:
Did you measure the FWHM of the stars in your image to confirm that they are about 0.6" FWHM?
This can hardly be the case since the image scale is about 0.6"/px.
|
You cannot like this item. Reason: "ANONYMOUS".
You cannot remove your like from this item.
Editing a post is only allowed within 24 hours after creating it.
You cannot Like this post because the topic is closed.
Arun H:
John Hayes:
You have produced a nice, sharp image but is it really diffraction limited?
I would have to respectfully agree with John here. Since I recently completed an M81 image myself, I looked up several images of this object, taken with 8" scopes as I was acquiring and processing. I would be skeptical of the claim that the supplied image, while good, is diffraction limited.
Hi Arun,
I really tried to make sure I was using the correct term here but if I am using this term incorrectly, I don't want to mislead people. I appreciate the feedback and am double checking my data as my claim was based of theoretical calculations. I was not sure if I should have said close to the diffraction limit, close to theoretical aperture resolution, etc. There are a lot of very experienced people in this hobby and I want to make sure I provide the right information as I plan to do more of these images.
-Dave
|
You cannot like this item. Reason: "ANONYMOUS".
You cannot remove your like from this item.
Editing a post is only allowed within 24 hours after creating it.
You cannot Like this post because the topic is closed.
David Huff:
John Hayes:
David,
This is a nice project but I am skeptical of your initial claim that this is a diffraction limited image. First, fast imaging does not remove the effects of atmospheric wavefront distortion. It can produce a diffraction limited image of the Airy pattern--IF the seeing is sufficiently good and the exposure is sufficiently short. Second, the isokinetic patch is typically pretty small and with tilt typically being the largest component in atmospheric wavefront distortion, it will vary over the field. When you stack a lot of images, the tilt won't be constant across the field and the increase in image sharpness gained from short exposures will be seriously diluted (relative to the diffraction limit.) The diameter of the Airy disk for your 200 mm f/8 system is about 1.4" but the FWHM will be 0.58". Did you measure the FWHM of the stars in your image to confirm that they are about 0.6" FWHM?
You have produced a nice, sharp image but is it really diffraction limited?
John
Hi John,
The platesolved focal length of my telescope and focal reducer attached was 1050mm so using that focal length, I then used the formula ( Pixel Size / Telescope Focal Length ) X 206.265 so ( pixel size 2.9um / 1050mm focal length) X 206.265 = 0.56968 (or 0.57)seconds of arc. The aperture of my RC8 is 203mm so the Dawes limit is 0.57 seconds of arch and Raleigh is about 0.69. So as you can see I am right at the theoretical diffraction resolution limit according to Dawes limit for which I based this. But of course that is a theoretical figure as it does not take into account seeing conditions which vary throughout the night. And I understand that fast imaging will not remove wavefront distortion but thanks to brute force averaging, the times when the atmosphere is less distorted is added and more distorted is rejected. So I had to start my stacking process with the image with the lowest background, lowest FWHM, roundest stars as a reference.
I could not measure the smaller stars as they were very faint with such a fast exposure. Now you have me intrigued and I am going to do some star interferometry on one of my best subframes to see if I can find a good measurement. My applications only measured the brightest stars. Thanks for sending me back down the rabbit hole LOL.
The size of the Airy disk only depends on aperture. Dawes limit and Raleigh limits relate to visually separating close stars and the theoretical resolution limit determined by some basic assumptions. The FWHM that I'm referring to is for the Airy disk, which is the point spread function of a circular aperture. Your system will have a slightly larger FWHM simply because you are using an obscured aperture. Don't measure the FWHM on the faintest stars. Use the FWHMEccentricity tool in PI. It will should give you good numbers. I'll be interested in what you got.
John
|
You cannot like this item. Reason: "ANONYMOUS".
You cannot remove your like from this item.
Editing a post is only allowed within 24 hours after creating it.
You cannot Like this post because the topic is closed.
John Hayes:
The size of the Airy disk only depends on aperture. Dawes limit and Raleigh limits relate to visually separating close stars and the theoretical resolution limit determined by some basic assumptions. The FWHM that I'm referring to is for the Airy disk, which is the point spread function of a circular aperture. Your system will have a slightly larger FWHM simply because you are using an obscured aperture. Don't measure the FWHM on the faintest stars. Use the FWHMEccentricity tool in PI. It will should give you good numbers. I'll be interested in what you got.
John
Hi John,
Sure I will get that for you. This was another source I used but was still unsure of "diffraction limit" was the correct term to use here. If it is not then I will remove that :-) I am always learning here. You might find this tool from Russell Croman useful if you have not seen this before.
Source: https://www.rc-astro.com/mtf-analyzer/
 |
You cannot like this item. Reason: "ANONYMOUS".
You cannot remove your like from this item.
Editing a post is only allowed within 24 hours after creating it.
You cannot Like this post because the topic is closed.
@John Hayes
This is what I got running the FHFM Eccentricity script on one of my subs. These images were captured using an OSC camera so I had to debayer then convert it to mono for the tool to work.
 |
You cannot like this item. Reason: "ANONYMOUS".
You cannot remove your like from this item.
Editing a post is only allowed within 24 hours after creating it.
You cannot Like this post because the topic is closed.
|
2" fwhm, not bad but hardly diffraction limited.
|
You cannot like this item. Reason: "ANONYMOUS".
You cannot remove your like from this item.
Editing a post is only allowed within 24 hours after creating it.
You cannot Like this post because the topic is closed.
andrea tasselli:
2" fwhm, not bad but hardly diffraction limited.
Hi @andrea tasselli
For the sake of accuracy then, I will remove that statement from the post. Thank you and @John Hayes for pointing that out!
-Dave
|
You cannot like this item. Reason: "ANONYMOUS".
You cannot remove your like from this item.
Editing a post is only allowed within 24 hours after creating it.
You cannot Like this post because the topic is closed.
I've been on an airplane for the last few hours so I'm a little slow to respond. Andrea is correct. What you have achieved in your final result is an image limited by the seeing. Don't get me wrong here: It is a very sharp image with great detail but you are a long way from being diffraction limited. Stacking short exposures gets rid of tracking errors and maybe a tiny bit of seeing induced blurring but you are mostly still seeing limited--and here I'm talking about star images using 1-2 second exposures with no evaluation of individual subs before stacking. If you really want to get a diffraction limited image, start with a 4" scope or smaller. One inch would be ideal. In that case, the diffraction limit will be larger than the seeing limit! It would also help to sample the image at the Nyquist rate of 4.88 px across the Airy disk to correctly assess the FWHM value.
My last comment is that in order to determine the quality of the final, stacked image, you should be running FWHMEccentricity on the final image; not one of the subs.
John
|
You cannot like this item. Reason: "ANONYMOUS".
You cannot remove your like from this item.
Editing a post is only allowed within 24 hours after creating it.
You cannot Like this post because the topic is closed.
David Huff:
John Hayes:
The size of the Airy disk only depends on aperture. Dawes limit and Raleigh limits relate to visually separating close stars and the theoretical resolution limit determined by some basic assumptions. The FWHM that I'm referring to is for the Airy disk, which is the point spread function of a circular aperture. Your system will have a slightly larger FWHM simply because you are using an obscured aperture. Don't measure the FWHM on the faintest stars. Use the FWHMEccentricity tool in PI. It will should give you good numbers. I'll be interested in what you got.
John
Hi John,
Sure I will get that for you. This was another source I used but was still unsure of "diffraction limit" was the correct term to use here. If it is not then I will remove that :-) I am always learning here. You might find this tool from Russell Croman useful if you have not seen this before.
Source: https://www.rc-astro.com/mtf-analyzer/
Thanks David! Russ did a fantastic job with this tool. I've had in mind writing something similar (with a few more image prediction tools) for years but I've never gotten around to it. This is much easier than the tools that I've been using for this stuff...so thanks to Russ for making this available!
John
|
You cannot like this item. Reason: "ANONYMOUS".
You cannot remove your like from this item.
Editing a post is only allowed within 24 hours after creating it.
You cannot Like this post because the topic is closed.
John Hayes:
I've been on an airplane for the last few hours so I'm a little slow to respond. Andrea is correct. What you have achieved in your final result is an image limited by the seeing. Don't get me wrong here: It is a very sharp image with great detail but you are a long way from being diffraction limited. Stacking short exposures gets rid of tracking errors and maybe a tiny bit of seeing induced blurring but you are mostly still seeing limited--and here I'm talking about star images using 1-2 second exposures with no evaluation of individual subs before stacking. If you really want to get a diffraction limited image, start with a 4" scope or smaller. One inch would be ideal. In that case, the diffraction limit will be larger than the seeing limit! It would also help to sample the image at the Nyquist rate of 4.88 px across the Airy disk to correctly assess the FWHM value.
My last comment is that in order to determine the quality of the final, stacked image, you should be running FWHMEccentricity on the final image; not one of the subs.
Thanks for your suggestions! I ran the FWHMEccentricity script on the 1x drizzled image that I used to produce my final image. Keep in mind that this was the summation of both 1 and 2 second sub exposures across different nights of seeing conditions. My final image had some deconvolution done and some other techniques like HDR Multiscale Transform to bring out the details, and Russ C's tools like BXT, NXT, and SXT during linear processing. I also used Generalized Hyperbolic Stretch to boost contrast in different parts of the galaxy to give it more depth. The way I process images would take a whole thread by itself :-)
The best thing about all this is I am learning so much! I wish I had time to go back to school and I would definitely major in Optics! But for now I am trying to get my kids through college first. Either way nice to meet you John and I appreciate your feedback.
 |
You cannot like this item. Reason: "ANONYMOUS".
You cannot remove your like from this item.
Editing a post is only allowed within 24 hours after creating it.
You cannot Like this post because the topic is closed.
|
So after all is said and done your integrated seeing is just 2.7". Which isn't bad at all but certainly not exceptional which would prompt the other question: was it worth it when you can get that sort of result with just "normal" long integrations?
|
You cannot like this item. Reason: "ANONYMOUS".
You cannot remove your like from this item.
Editing a post is only allowed within 24 hours after creating it.
You cannot Like this post because the topic is closed.
|
What I would also add here - a simple search of Astrobin M81 images would have revealed several taken with 8" (and even smaller) scopes that show significantly greater detail. Again, I state this not to cast shade on this image, which I think is good, but the claim was made, at first, that it was diffraction limited, and the image description still claims it is the "most detailed" M81 image. I don't think that would be supported by objective comparison to other good images. It is certainly a detailed image, but a claim that it is the "most detailed" needs more evidence than is provided.
|
You cannot like this item. Reason: "ANONYMOUS".
You cannot remove your like from this item.
Editing a post is only allowed within 24 hours after creating it.
You cannot Like this post because the topic is closed.
andrea tasselli:
So after all is said and done your integrated seeing is just 2.7". Which isn't bad at all but certainly not exceptional which would prompt the other question: was it worth it when you can get that sort of result with just "normal" long integrations?
This is fast imaging not lucky imaging where you would only keep a percentage of frames with the best FWHM, fast imaging you have to keep all the frames, even the blurry ones to add to the SNR. So sharpness wasn't the goal here, SNR was. Where I live, M81 is right over the skyglow of Chicago, and every time I tried imaging this galaxy, the light pollution would ruin it. I had some success with my RASA 8" but now the galaxy was so small you can't see any details. So if anything, taking so many short exposures really helped reject most of the light pollution! I may one day use subframe selector to go through all of the data on only keep the best PSF Signal Weight images. But for now I was actually able to image something I could not before at a longer focal length because of the light pollution. See the images below and you will see my rejections is mostly light polluted shot noise :-) Yes some had high clouds but not this bad.
 |
You cannot like this item. Reason: "ANONYMOUS".
You cannot remove your like from this item.
Editing a post is only allowed within 24 hours after creating it.
You cannot Like this post because the topic is closed.
Arun H:
What I would also add here - a simple search of Astrobin M81 images would have revealed several taken with 8" (and even smaller) scopes that show significantly greater detail. Again, I state this not to cast shade on this image, which I think is good, but the claim was made, at first, that it was diffraction limited, and the image description still claims it is the "most detailed" M81 image. I don't think that would be supported by objective comparison to other good images. It is certainly a detailed image, but a claim that it is the "most detailed" needs more evidence than is provided.
Hi,
I was not trying to claim anything. I'm a honest person who made a honest mistake in my content. I have updated it to reflect that. I appreciate the criticism :-)
I change the to my so that it reflects my own images not the community. I even updated all of my social media posts :-)
|
You cannot like this item. Reason: "ANONYMOUS".
You cannot remove your like from this item.
Editing a post is only allowed within 24 hours after creating it.
You cannot Like this post because the topic is closed.
Hi All,
To help make sense of what I am doing here shooting such short exposures and many of them, here is an excellent lecture given by Robin Glover that where I got the idea: https://www.youtube.com/watch?v=3RH93UvP358
I live in a suburb south of Chicago and unfortunately, some subjects like M81 and other famous galaxies are right over Chicago's light pollution. For this reason I made my rig as portable as possible so I can travel 2 hours south to a Bortle 3 dark site. But lately I have been working a lot and have not had time to travel. So I have been forced to image from my light polluted area. If you look at my AstroBin profile, you will see all of my crazy experiments to try to get the best images from my backyard. Some of my images were so light polluted that I was almost unable to fully subtract the light pollution and gradients without removing a lot of the subject. But my best images were from the dark site, well until now :-) I hope this forum post helps someone that is stuck in a heavy light polluted location like where I am as it seems to be getting worse every year.
Clear Skies!
Dave
|
You cannot like this item. Reason: "ANONYMOUS".
You cannot remove your like from this item.
Editing a post is only allowed within 24 hours after creating it.
You cannot Like this post because the topic is closed.
David Huff:
John Hayes:
I've been on an airplane for the last few hours so I'm a little slow to respond. Andrea is correct. What you have achieved in your final result is an image limited by the seeing. Don't get me wrong here: It is a very sharp image with great detail but you are a long way from being diffraction limited. Stacking short exposures gets rid of tracking errors and maybe a tiny bit of seeing induced blurring but you are mostly still seeing limited--and here I'm talking about star images using 1-2 second exposures with no evaluation of individual subs before stacking. If you really want to get a diffraction limited image, start with a 4" scope or smaller. One inch would be ideal. In that case, the diffraction limit will be larger than the seeing limit! It would also help to sample the image at the Nyquist rate of 4.88 px across the Airy disk to correctly assess the FWHM value.
My last comment is that in order to determine the quality of the final, stacked image, you should be running FWHMEccentricity on the final image; not one of the subs.
Thanks for your suggestions! I ran the FWHMEccentricity script on the 1x drizzled image that I used to produce my final image. Keep in mind that this was the summation of both 1 and 2 second sub exposures across different nights of seeing conditions. My final image had some deconvolution done and some other techniques like HDR Multiscale Transform to bring out the details, and Russ C's tools like BXT, NXT, and SXT during linear processing. I also used Generalized Hyperbolic Stretch to boost contrast in different parts of the galaxy to give it more depth. The way I process images would take a whole thread by itself :-)
The best thing about all this is I am learning so much! I wish I had time to go back to school and I would definitely major in Optics! But for now I am trying to get my kids through college first. Either way nice to meet you John and I appreciate your feedback.
I'm sorry David...I was in a hurry and wasn't very clear. You should run FWHMEccentricity on the stacked, UNSTRETCHED linear image. Once you stretch it, you no longe have stellar profiles that can be fit to a Moffat function. That's why your MAD (Mean Absolute Difference) residual is just about equal to the MAD FWHM--the star profiles aren't even close to a good fit to Moffat4. The result is that this measurement is showing a FWHM value that's way too large!
John
|
You cannot like this item. Reason: "ANONYMOUS".
You cannot remove your like from this item.
Editing a post is only allowed within 24 hours after creating it.
You cannot Like this post because the topic is closed.
That Robin Glover lecture is excellent - but I don’t think it says what you think it does. The noise from Light pollution is additive in quadrature, meaning, it does not depend on the length of your exposure time but just the total integration time (neglecting things like sensor saturation). What is true is that, in heavily light polluted sites, you can afford to take much shorter exposures because the noise from LP quickly swamps read noise. But generally, and especially with slower scopes, this occurs in several tens of seconds, not a second or two. Your overall noise term is:
SQRT(N*RN^2+LP+DC)
where LP and DC are the TOTAL light pollution signal and TOTAL dark current term - added in this way because they follow a Poisson distribution with mean = standard deviation, RN is the sensor read noise, and N is the number of subs.
Note that, the larger the N, the larger the read noise component - except that, in light polluted sites, you can get away with larger N because LP is so dominant and the benefit of doing so is better tracking, fewer exposures lost due to satellite interference, wind, etc. All this is covered in that lecture. However, as I said, you'd usually want exposures in the few tens of seconds, and you can actually calculate this using your camera and scope parameters and the PixInsight SkyLimitingExposure script.
By doing what you have done, you have not optimized to overwhelm the read noise. That is, you have a very significant read noise component while not really impacting noise from light pollution.
|
You cannot like this item. Reason: "ANONYMOUS".
You cannot remove your like from this item.
Editing a post is only allowed within 24 hours after creating it.
You cannot Like this post because the topic is closed.
Arun H:
That Robin Glover lecture is excellent - but I don’t think it says what you think it does. The noise from Light pollution is additive in quadrature, meaning, it does not depend on the length of your exposure time but just the total integration time (neglecting things like sensor saturation). What is true is that, in heavily light polluted sites, you can afford to take much shorter exposures because the noise from LP quickly swamps read noise. But generally, and especially with slower scopes, this occurs in several tens of seconds, not a second or two. By doing what you have done, you have not optimized to overwhelm the read noise. That is, you have a very significant read noise component. A better approach is to actually calculate the sky limiting exposure in PixInsight and use that number. Which Inexpect will be a few tens of seconds.
I think when I started this project, I originally was trying to do something similar to speckle imaging, other concept I am trying to grasp but then I realized because of the light pollution where I am at, the shot noise would overwhelm the signal so I agree with you. So I found the sweet spot of 2s that would where the total noise both shot and sensor was at only 10%. I actually got much better SNR using that exposure time. But I got a better PSF with the 1s. It may even be possible that the 2 second sub exposures may have been better but the seeing was much worse during the time I captured this images. Sharpcap smart histogram did show that the best exposure that reduced down to 1% noise was about 25 seconds similar to what you are saying. Now I am imaging M51 with 4 second exposures (still 10% noise) but with the camera originally wanted to use that creates a pixel scale of 0.76 arcsec/px and now I am getting a lot better results! Sharpcap smart histogram (similar to calculator from PixInsight) still showed about 28 seconds for 1% noise but in stacking more exposures, the noise decreases by the square root of each exposure so the total stack would still have less noise. Also I was able to drizzle at 2x this time and the details are crisp! I guess I am trying to get the best of both worlds, reduce light pollution noise but at the same time reduce the PSF to increase resolution. This is all in the spirit of experimentation regardless of outcome, I like experimenting myself to see what is possible.
|
You cannot like this item. Reason: "ANONYMOUS".
You cannot remove your like from this item.
Editing a post is only allowed within 24 hours after creating it.
You cannot Like this post because the topic is closed.
David Huff:
Now I am imaging M51 with 4 second exposures (still 10% noise) but with the camera originally wanted to use that creates a pixel scale of 0.76 arcsec/px and now I am getting a lot better results! Sharpcap smart histogram (similar to calculator from PixInsight) still showed about 28 seconds for 1% noise but in stacking more exposures,
Your overall noise will certainly decrease with stacking, regardless your exposure length. The question is how much over the sky limiting exposure. But it is certainly not a requirement that you use the sky limiting exposure which is only based on optimizing noise. There are, as you point out, other reasons to use shorter or longer exposures. As long as you are getting good results and having fun, that probably matters the most!
|
You cannot like this item. Reason: "ANONYMOUS".
You cannot remove your like from this item.
Editing a post is only allowed within 24 hours after creating it.
You cannot Like this post because the topic is closed.
John Hayes:
David Huff:
John Hayes:
I've been on an airplane for the last few hours so I'm a little slow to respond. Andrea is correct. What you have achieved in your final result is an image limited by the seeing. Don't get me wrong here: It is a very sharp image with great detail but you are a long way from being diffraction limited. Stacking short exposures gets rid of tracking errors and maybe a tiny bit of seeing induced blurring but you are mostly still seeing limited--and here I'm talking about star images using 1-2 second exposures with no evaluation of individual subs before stacking. If you really want to get a diffraction limited image, start with a 4" scope or smaller. One inch would be ideal. In that case, the diffraction limit will be larger than the seeing limit! It would also help to sample the image at the Nyquist rate of 4.88 px across the Airy disk to correctly assess the FWHM value.
My last comment is that in order to determine the quality of the final, stacked image, you should be running FWHMEccentricity on the final image; not one of the subs.
Thanks for your suggestions! I ran the FWHMEccentricity script on the 1x drizzled image that I used to produce my final image. Keep in mind that this was the summation of both 1 and 2 second sub exposures across different nights of seeing conditions. My final image had some deconvolution done and some other techniques like HDR Multiscale Transform to bring out the details, and Russ C's tools like BXT, NXT, and SXT during linear processing. I also used Generalized Hyperbolic Stretch to boost contrast in different parts of the galaxy to give it more depth. The way I process images would take a whole thread by itself :-)
The best thing about all this is I am learning so much! I wish I had time to go back to school and I would definitely major in Optics! But for now I am trying to get my kids through college first. Either way nice to meet you John and I appreciate your feedback.
I'm sorry David...I was in a hurry and wasn't very clear. You should run FWHMEccentricity on the stacked, UNSTRETCHED linear image. Once you stretch it, you no longe have stellar profiles that can be fit to a Moffat function. That's why your MAD (Mean Absolute Difference) residual is just about equal to the MAD FWHM--the star profiles aren't even close to a good fit to Moffat4. The result is that this measurement is showing a FWHM value that's way too large! Supposedly the finish quality of the mirrors is 1/12λrms
John
No worries, I appreciate you help. Actually this was the unstretched linear image. I think the FWHM got bigger because I used all of the subframes whereas I think I went through and culled all of the bloated ones I would have yielded tighter stars. I was a bit to dependant on deconvolution here and both traditional deconvolution and BlurXterminator work better with a higher SNR image.
I am in the process of working with my M51 data now which is a smaller subset and this time I am going to cull the bloated images. The first test was to follow what PixInsight recommends for their FastIntegration process. Now with that done and out of the way time to optimize. Also I used a camera with bigger pixels this time giving me a pixel scale of about 0.7arcsec/px. I am actually able to 2x drizzle this time and reveal more details when I use deconvolution as it looks like I am able to increase the spatial resolution.
|
You cannot like this item. Reason: "ANONYMOUS".
You cannot remove your like from this item.
Editing a post is only allowed within 24 hours after creating it.
You cannot Like this post because the topic is closed.
to create to post a reply.


